

(Photo by Alfons Morales, on Unsplash)
There are several ways to dig for precious information in listener logs, for example this method described by Arup Nanda or this one by Liron Amitzi.
I currently work in an environment with 40+ servers and 550+ databases managed by Grid Infrastructure. I recently wanted to help a colleague who was experiencing problems with a brand new installed application. Her application should connect to a database in another VLAN. Our first intuition was to check if the application could, at least, reach the database. Since the database resides on a Grid Infrastructure cluster, it would have been tedious to check all (scan-) listener logs spread accross all servers. This is where Splunk has proven useful.
There is a Splunk Add-on for Oracle Database. It allows Splunk to handle all sort of useful log and trace files generated by Oracle Database, and in particular, plain text and XML listener log files. It is also possible to get information from databases themselves when combined with Splunk DB Connect. In my case, the latter has not been necessary.
With Splunk Add-on for Oracle Database, you don’t have to describe each listener log field as the add-on does it for you. You can also define your own custom fields.
After installing and configuring the add-on by specifying source type and log files locations, it is much easier and faster to get exactly the info you need.
For example, I want to look for all the connections to database tflora2t from host 192.168.78.51 during the last 15 minutes :

Fine, I get 2 lines : one of them is from a scan listener, and the other one from the local listener. I can check that by clicking on the source link :

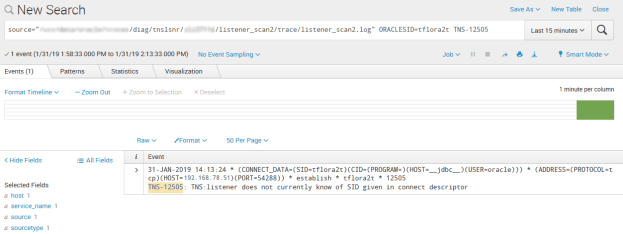
Of course you can fully take advantage of Splunk by using way more complex queries, by specifying for example a host, a source file, an IP, etc … Or you can look for a specific TNS error :
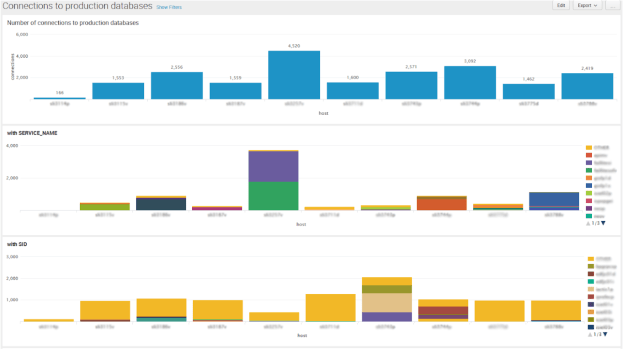
Dashboards and reports in Splunk offer loads of possbilities. For example, I can determine, at a glance, which server receives most connections, and in particular, I can catch applications using SID to connect :
For the moment, I explored Splunk’s potential with listeners logs, alert logs, and also with the huge amount of log files generated by Grid Infrastructure. When something goes wrong with a cluster, I feel less like looking for a needle in a haystack 🙂
